My Qwen3-8B context experiment stopped during the first 8K/18 primary startup. Windows available RAM crossed the guard’s 2 GiB floor. The planned eighteen-run batch has zero final eligible primary results because its post-run input and runtime binding is missing.
Before that batch, six separately validated scouts completed. I report those six individual observations below, n=1 per condition. They are exploratory samples, not substitutes for the unfinished repetitions.
What stopped, and what remains usable
These are separate evidence groups. I preserved their original states.
| Group | Actual outcome | Performance eligibility |
|---|---|---|
| Six current-cohort scouts: 2K/4K/8K × all/18 | Original raw checks passed; pre/post binding matched; both guards exited 0 | One descriptive observation per condition |
| Earlier 16K/18 scout | Host floor abort during startup; original post-binding absent | Unavailable |
| 16K/all scout | NOT_RUN | Unavailable |
| Bounded primary: 18 planned trials | Six calls; five provisional checks; stopped at 8K/18 R1 | Zero final eligible trials |
| Separate fresh-build reader: 2K/all | Raw checks and pre/post binding passed; both request guards exited 0 | One separate replay; never a primary repetition |
The primary host guard’s terminal record was:
{
  "exit_code": 124,
  "abort": "host_ram_below_2gib",
  "elapsed_seconds": 900.5779999999795
}
That is elapsed whole-batch guard time, not the failed trial’s startup time
or completion latency. The observed guest child exit was -9; the driver’s
signal-handler receipt declared 143. These record different processes.
Cleanup was attempted; that flag alone does not prove process absence.
The batch’s stale running string does not mean it survived the terminal guard
record. The abort stayed latched after RAM recovered. Earlier prechecks stayed
trial_checks_passed_batch_post_pending; I did not promote them, copy in a later
closure snapshot, or retry the batch.
The previous 16K/18 scout stopped after 82.344 guard seconds, also during startup.
Its original result remained started, without runtime-after or final binding.
16K/all was not launched. Neither record establishes CUDA OOM, a maximum context,
or 16K generation speed. Built-in startup warmup is not the evaluated long
completion request.
The saved host safety trace
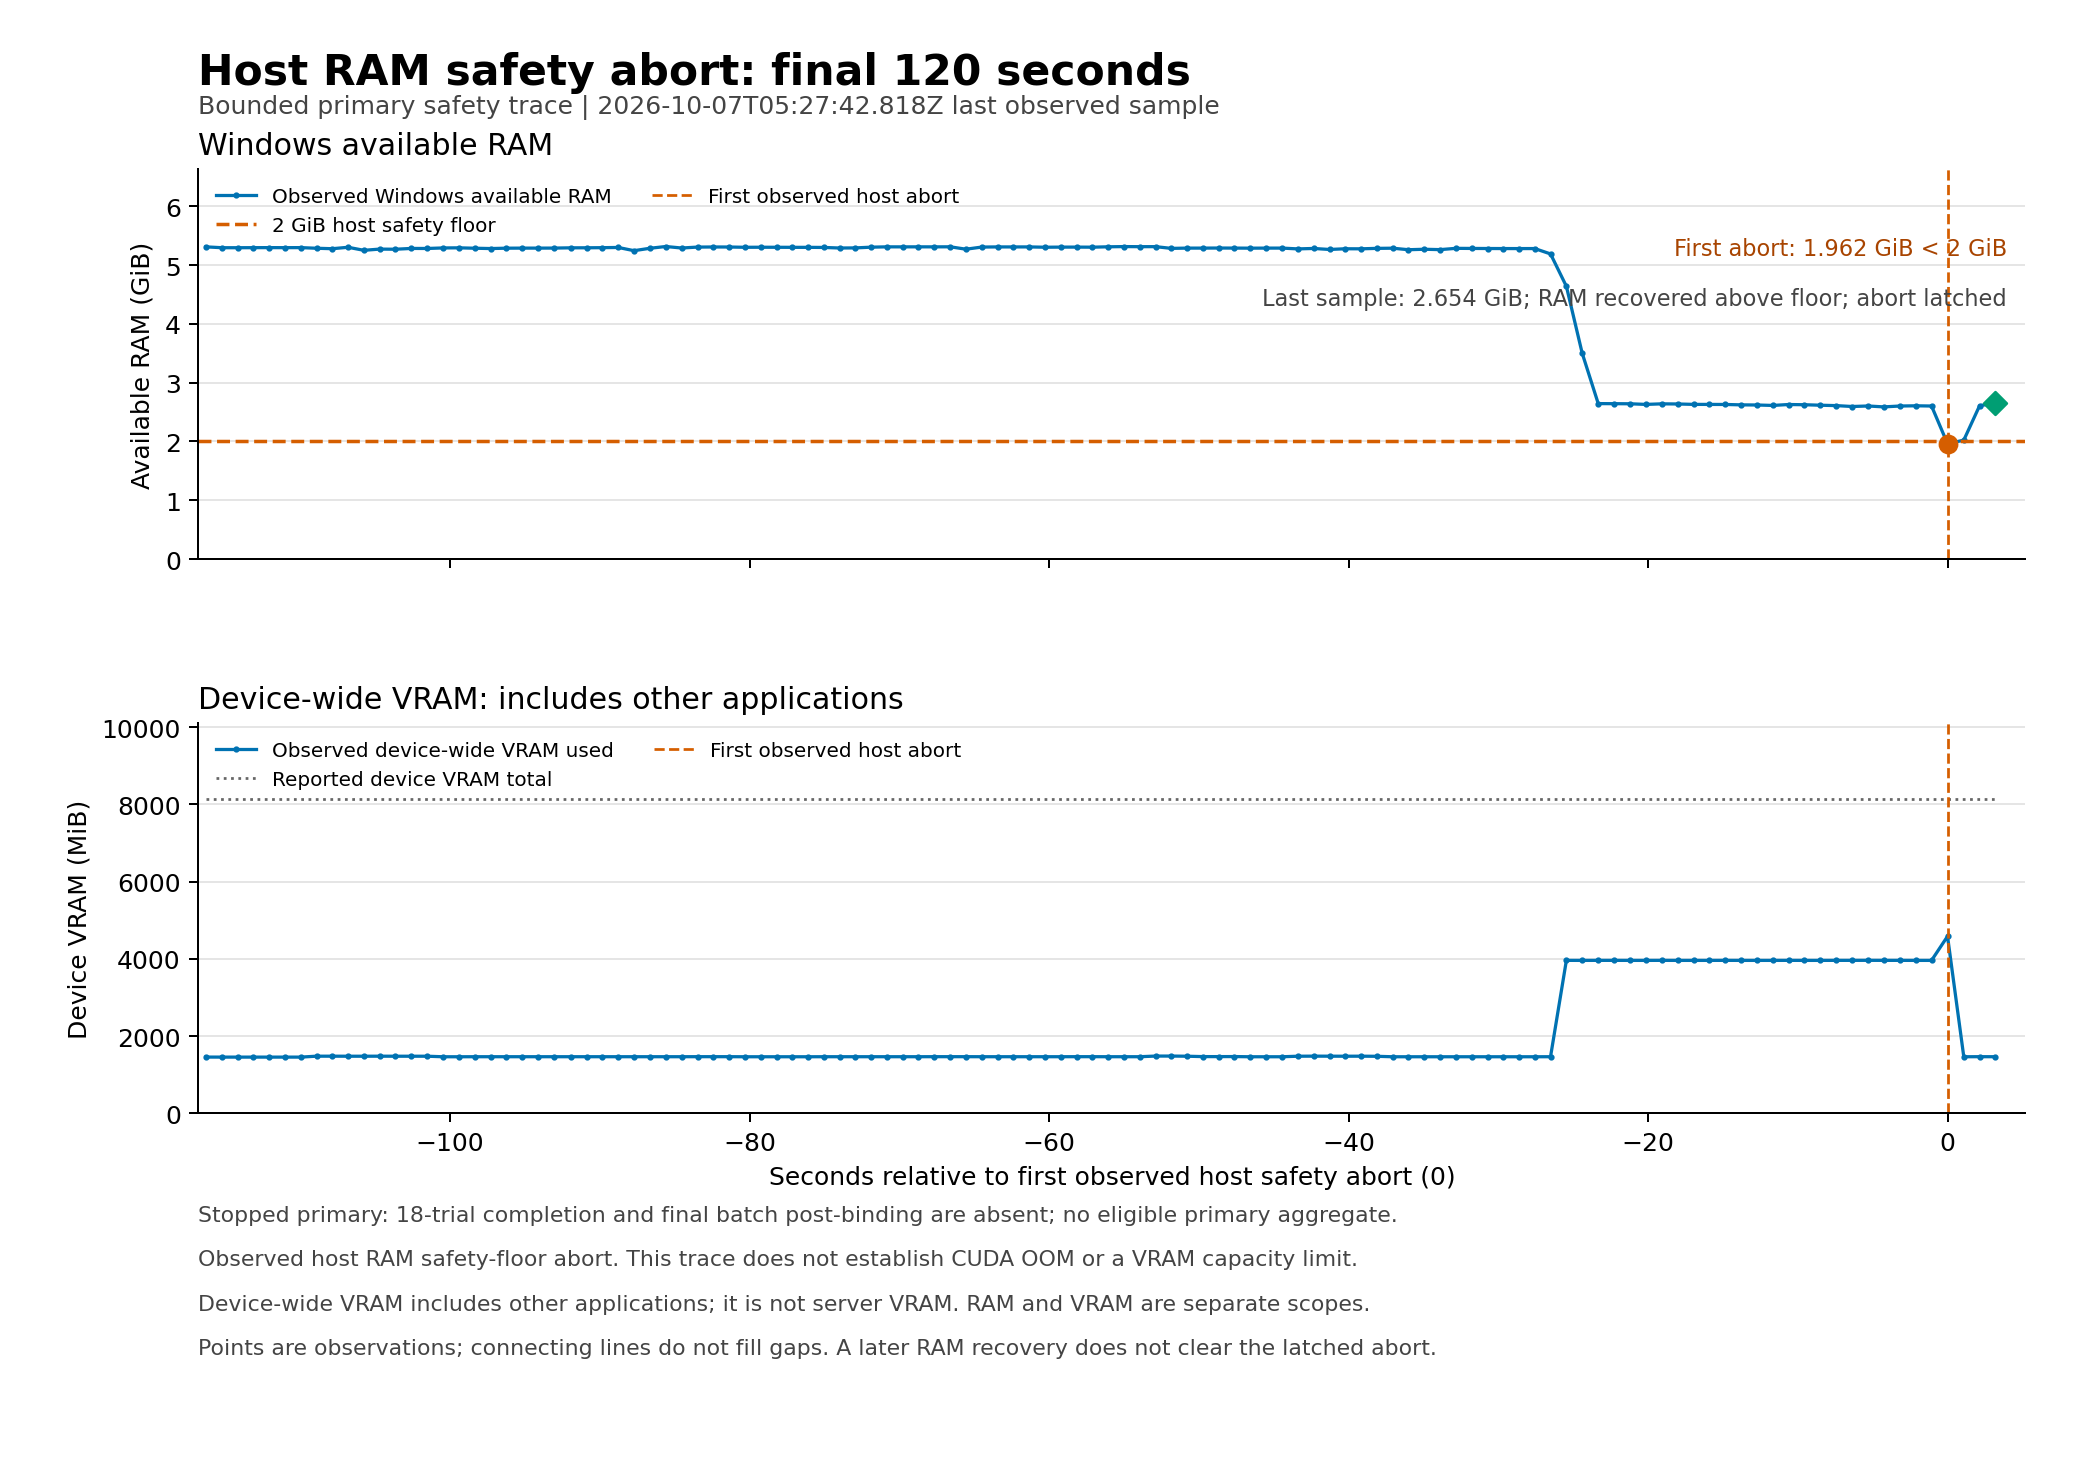
The figure shows 114 saved observations in the final 120-second window of the 852-row host trace. Lines connect samples; they do not capture shorter spikes. The VRAM panel uses the device-wide counter and does not identify the server’s allocation or establish a GPU memory limit.
| Saved observation | Host available bytes | Host available, GiB | Device-wide VRAM, MiB | Abort field |
|---|---|---|---|---|
| Last sample without abort | 2,795,352,064 | 2.603 | 3,961 | null |
| First sample with abort | 2,106,507,264 | 1.962 | 4,585 | host_ram_below_2gib |
| Last saved sample | 2,849,406,976 | 2.654 | 1,467 | host_ram_below_2gib |
The floor was 2,147,483,648 bytes. Later recovery did not clear the abort. The numeric trace is in the evidence download below.
Environment and locked inputs
Ordinary host applications remained open. The test used a dedicated WSL guest.
| Item | Recorded value |
|---|---|
| Measurement date | 2026-10-07 |
| Host | Windows 11 Home; WSL reported build 10.0.26200.9457 |
| CPU | AMD Ryzen 7 7800X3D |
| Windows visible physical memory | 15,603,676 KiB, approximately 14.88 GiB |
| GPU counter | RTX 5060 Ti; 8,151 MiB total |
| NVIDIA driver | 610.88 |
| WSL package / packaged kernel | 2.7.12.0 / 6.18.33.2-2 |
| Actual guest kernel | 6.18.33.2-microsoft-standard-WSL2 |
| Guest | Ubuntu 24.04.4 LTS, x86-64 |
| Recorded GNU C++ / CMake | 13.3.0 / 3.28.3, Ninja |
| CUDA compiler | 13.2, V13.2.86 |
| Build | Release; GGML_CUDA=ON; GGML_NATIVE=ON; 120-real |
| llama.cpp commit | e5a8d439cef31f27fad6938233da10dae1ba5631 |
| Model repository | Qwen/Qwen3-8B-GGUF |
| Model revision | 7c41481f57cb95916b40956ab2f0b139b296d974 |
| File | Qwen3-8B-Q4_K_M.gguf |
| File bytes | 5,027,783,488 |
| Model SHA-256 | d98cdcbd03e17ce47681435b5150e34c1417f50b5c0019dd560e4882c5745785 |
The selected environment and protocol records include the saved host version fields, guest version output, selected original build-cache fields, guard terminals and executed Linux-control output. Each selection identifies its original file by size and SHA-256; its transformed bytes have a separate digest. These are saved records, not later live queries.
The host memory counter is not model RSS or a WSL allocation limit. The two kernel labels came from different commands. The model is pinned to this revision; the engine is pinned to this source.
Six scout observations, n=1
Each scout used one fresh server and one raw /completion request. Integer
tokens were progressively longer prefixes of an invented notebook, without a
chat template. Capacity and actual input length changed together. This cannot
isolate the context-size flag with an identical prompt or measure answer quality.
Timing values below are individual observations, rounded to three decimals. Prefill and decode rates are rounded to two decimals. There are no repeat medians, ranges, confidence intervals or stable speed estimates.
| Context | GPU argument | Input / output tokens | Startup, s | First content, s | Complete, s | Server prefill, tokens/s | Server decode, steps/s |
|---|---|---|---|---|---|---|---|
| 2,048 | all | 1,792 / 128 | 18.044 | 0.647 | 2.435 | 2,803.54 | 71.00 |
| 2,048 | 18 | 1,792 / 128 | 24.374 | 3.289 | 16.302 | 547.61 | 9.75 |
| 4,096 | all | 3,840 / 128 | 18.146 | 1.367 | 3.242 | 2,825.07 | 67.73 |
| 4,096 | 18 | 3,840 / 128 | 24.167 | 7.210 | 22.946 | 533.29 | 8.07 |
| 8,192 | all | 7,936 / 128 | 17.922 | 2.998 | 5.076 | 2,661.95 | 60.93 |
| 8,192 | 18 | 7,936 / 128 | 24.262 | 16.166 | 37.396 | 491.32 | 5.98 |
Client first-content time starts at request submission and ends at the first nonempty content SSE event. Completion ends at the terminal event. Both exclude server startup. Server prefill/decode use the engine’s separate clocks.
The pinned engine times 127 decode steps for 128 outputs: the first output comes from the final prompt logits. For the 2K/all scout, the final event records:
tokens_evaluated = 1792
tokens_predicted = 128
prompt_ms = 639.191
predicted_ms = 1788.781
predicted_per_second = 70.99807075321127
truncated = false
stop_type = limit
decode arithmetic: 127000 / 1788.781
This is not 128 / client completion time. The definition is in the pinned
server timing code.
Memory has several scopes
These sampled peaks cover startup, request and shutdown. Baseline is separate. GiB values below are rounded to three decimals; VRAM values are MiB counters. Again, every row is one scout, n=1.
| Context / GPU argument | Device VRAM baseline, MiB | Device sampled peak, MiB | Peak minus baseline, MiB | Process RSS peak, GiB | Host available minimum, GiB | Guest available minimum, GiB | Guest swap peak, bytes |
|---|---|---|---|---|---|---|---|
| 2K / all | 1,684 | 6,602 | 4,918 | 0.786 | 4.974 | 5.994 | 0 |
| 2K / 18 | 1,685 | 4,436 | 2,751 | 2.982 | 2.593 | 3.790 | 0 |
| 4K / all | 1,681 | 6,888 | 5,207 | 0.787 | 4.960 | 6.004 | 0 |
| 4K / 18 | 1,682 | 4,555 | 2,873 | 3.131 | 2.630 | 3.642 | 0 |
| 8K / all | 1,694 | 7,198 | 5,504 | 0.790 | 4.836 | 5.999 | 0 |
| 8K / 18 | 1,694 | 4,841 | 3,147 | 3.430 | 2.276 | 3.338 | 0 |
Device-wide WDDM usage includes the desktop and other applications. Peak minus baseline is not process VRAM. Linux RSS/HWM, backend buffers and whole-guest memory overlap; I do not add them. RSS is approximate process accounting, not a complete attribution of CUDA or mapped-file memory. See the Linux proc documentation and NVIDIA counter documentation.
Zero sampled guest swap does not establish that Windows avoided paging or WDDM migration. I collected no host paging or GPU-transfer trace. At validated process-exit boundaries, null RSS/HWM stays unavailable, not zero.
Repeated reads of one heartbeat are one GPU observation. These are the six saved coverage records; gap values are rounded to three decimals. Sampled peaks can miss shorter spikes.
| Scout | Memory rows | Distinct host heartbeats | Largest memory gap, s | Largest heartbeat gap, s |
|---|---|---|---|---|
| 2K / all | 81 | 77 | 1.000 | 1.104 |
| 2K / 18 | 102 | 97 | 1.001 | 1.109 |
| 4K / all | 82 | 78 | 1.000 | 1.064 |
| 4K / 18 | 108 | 102 | 1.000 | 1.130 |
| 8K / all | 84 | 80 | 1.009 | 1.071 |
| 8K / 18 | 123 | 116 | 1.000 | 1.108 |
Offload and the attempted protocol
In this pinned model placement, --gpu-layers 18 includes the output layer.
Only repeating layers have KV: 17 GPU blocks and 19 CPU blocks, not 18/18.
All-offloaded uses 36 GPU KV blocks. The startup logs matched these F16 amounts:
| Context | all: GPU KV, MiB | 18: GPU KV, MiB | 18: CPU KV, MiB |
|---|---|---|---|
| 2,048 | 288 | 136 | 152 |
| 4,096 | 576 | 272 | 304 |
| 8,192 | 1,152 | 544 | 608 |
See the pinned placement calculation and KV loop. These are backend buffers, not additional RSS or global VRAM measurements.
The common server settings were:
--fit off --parallel 1
--cache-type-k f16 --cache-type-v f16 --flash-attn on
--batch-size 512 --ubatch-size 128 --threads 4 --threads-batch 4
--no-cache-prompt --cache-ram 0 --no-cache-idle-slots
--no-context-shift --ctx-checkpoints 0
--load-mode none --lazy-mode off --verbosity 4
--perf --warmup --offline --host 127.0.0.1
--cors-origins http://127.0.0.1
{
  "stream": true,
  "cache_prompt": false,
  "n_predict": 128,
  "temperature": 0,
  "seed": 20260910,
  "ignore_eos": true,
  "return_tokens": true
}
Context/offload arguments selected the table’s capacity and all or 18.
The six core scripts stayed fixed. After the incomplete 16K scout, I declared a
new six-condition primary scope before any primary request. It planned one pass in canonical order, one in reverse order and one in
half-rotated order: three trials per condition, eighteen trials total.
The separately bound driver added a complete model size/SHA read, then bounded idle observations before every original trial call. All six attempted calls had that preparation. Scouts did not thereby become identically prepared primary samples. Model reads can warm file caches, sit outside TTFT, and do not guarantee RAM stability. Idle windows are waits, not model retries.
| Preserved check | Limit |
|---|---|
| Whole-model read | Cooperative 120 s, checked around 8 MiB chunks |
| Auxiliary idle windows | 30 s each; at most 10 within 300 s |
| Original baseline / recovery | 30 s / 30 s |
| Baseline RAM / VRAM spread | 512 MiB / 128 MiB |
| Baseline GPU median utilization | At most 10% |
| Drift from first primary baseline | 1 GiB host RAM / 256 MiB device VRAM |
| Startup / first content / total request | 120 s / 120 s / 180 s |
| Host RAM / disk floor | 2 GiB / 5 GiB |
| Internal primary budget | 7,920 s |
| Actual outer guard budget | 15,480 s |
None of these floors was relaxed after the stop. I do not yet know which host memory components caused the floor crossing. The preserved host trace shows the observed stop; it cannot isolate file-cache behavior, another application, or memory migration as its cause.
Evidence and reproduction boundary
The transformed evidence bundle contains six-scout CSV values, numeric event clocks, returned-token counts, memory projections, selected startup log segments, primary safety observations and a manifest. Its archive SHA-256 is:
43ea3feb09a4a065738a21ba4c494304cedd29eec968e8e9cdd975ac10f5c058
The archive READMEs and status fields record the unpublished preparation snapshot from 2026-10-07. They are retained as historical metadata.
The exporter rechecked saved scout bindings, original receipts/guards and raw numeric calculations. It did not claim full primary provenance PASS or rehash live model/binary bytes. Public projections allow selected recomputation; they are redacted transformations with different hashes from originals. Generated content, token IDs/text, personal paths and free-form errors are omitted.
One separate fresh-build replay
I built the pinned source in a new build directory with a new build cache, then ran exactly one 2K/all request. The existing host, guest, source checkout, model file and toolchain were reused. This is a same-lab replay, not a clean OS or a new computer. The fresh process still used startup warmup and existing file caches.
| Reader-only observation | Recorded value |
|---|---|
| Context / GPU argument | 2,048 / all |
| Input / generated tokens | 1,792 / 128 |
| Startup | 19.153 s |
| Client first content / completion | 0.664 s / 2.424 s |
| Server prompt / decode time | 647.780 ms / 1,768.160 ms |
| Timed decode steps / rate | 127 / 71.826 steps/s |
| Device VRAM baseline / sampled peak | 1,452 / 6,371 MiB |
| Process RSS sampled peak | 843,456,512 bytes |
| Host / guest available minimum | 5,147,660,288 / 6,431,133,696 bytes |
| Guest swap sampled peak | 0 bytes |
| Memory rows / distinct host heartbeats | 82 / 78 |
| Largest memory / heartbeat gap | 1.001 s / 1.106 s |
| Request guards, host / guest | 0 / 0; no abort |
| Raw request checks / pre-post binding | PASS / PASS |
The reader has its own raw numeric projections and validation receipt in the evidence bundle. Its success neither repairs primary post-binding nor supplies a second scout repetition. I do not combine its clocks or memory baseline with the earlier table.
Inspectable source and executed controls
The copied 21-asset source package subsequently ran these no-GPU controls on Windows Python 3.12.14. The 21 source assets stayed unchanged.
| Packaged control suite | Tests run | Passed | Skipped |
|---|---|---|---|
| Collector controls | 29 | 29 | 0 |
| Raw-validator controls | 60 | 60 | 0 |
| Setup controls | 3 | 3 | 0 |
| Scope-driver controls | 64 | 63 | 1 |
| Total | 156 | 155 | 1 |
The skip required unavailable Windows symlink permission. Installed Linux driver controls separately passed 64/64; neither control result is a reader or GPU measurement. The package omits the model, source checkout, toolchain, binaries, guest disk and private handoffs. Exact guest registration and omitted handoff/Prepare CLI dependencies prevent turnkey setup. The inspectable source download contains the exact copied scripts, synthetic fixtures, selected control receipt and setup limitations. It is a prepared-lab scaffold, not a turnkey installer. The model and upstream code retain their respective licenses; this bundle makes no new license grant for the local scripts.