PyTorch 2.13.0+cu126 found my RTX 5060 Ti and returned True here:
torch.cuda.is_available()  True
torch.cuda.device_count()  1
device capability          (12, 0)
It also printed the warning that mattered:
Found GPU0 NVIDIA GeForce RTX 5060 Ti which is of compute capability (CC) 12.0.
...
Your installed torch==2.13.0+cu126 does not include kernels for this GPU.

NVIDIA GeForce RTX 5060 Ti with CUDA capability sm_120 is not compatible
with the current PyTorch installation.
The current PyTorch install supports CUDA capabilities
sm_50 sm_60 sm_70 sm_75 sm_80 sm_86 sm_90.
A one-byte tensor could be allocated. The next fill_ failed:
torch.AcceleratorError: CUDA error: no kernel image is available for execution on the device
The result was not a clean “nothing works.” CPU-to-GPU copies and four torch.dot sizes worked. A matrix multiply also worked when I prepared its inputs on the CPU. GPU fill_, pointwise add, random-number generation, and linspace did not.
I ran the same core matrix with the official cu130 and cu132 wheels. Both passed all 30 core child processes. cu126 passed 15, all from metadata and torch.dot; the count is a description of this fixed probe set, not a compatibility percentage.
Quick answer: for this Linux x86-64/WSL2 RTX 5060 Ti, I would install PyTorch 2.13 from the cu130 index. PyTorch lists CUDA 13.0 as a stable 2.13 build and the 2.13 release post says it remains the default. cu132 also passed my tested paths, but the release matrix snapshot I checked labels it experimental. cu126 enumerated this GPU, but its GPU tensor-creation and pointwise cells failed with no-kernel-image errors on this host.
Test setup
I installed a fresh Ubuntu distro after preregistering the wheel matrix. There was no system CUDA Toolkit, nvcc, or Linux NVIDIA display driver. WSL exposed the Windows driver through /usr/lib/wsl/lib/libcuda.so.1.
The virtual environments used only these indexes:
test ! -e .venv-cu126 && \
python3 -m venv .venv-cu126 && \
.venv-cu126/bin/python -m pip install --no-cache-dir \
  torch==2.13.0 --index-url https://download.pytorch.org/whl/cu126

test ! -e .venv-cu130 && \
python3 -m venv .venv-cu130 && \
.venv-cu130/bin/python -m pip install --no-cache-dir \
  torch==2.13.0 --index-url https://download.pytorch.org/whl/cu130

test ! -e .venv-cu132 && \
python3 -m venv .venv-cu132 && \
.venv-cu132/bin/python -m pip install --no-cache-dir \
  torch==2.13.0 --index-url https://download.pytorch.org/whl/cu132
Pip resolved the expected local versions, and all three environments passed pip check:
| Index | torch.__version__ | torch.version.cuda | torch.cuda.get_arch_list() |
|---|---|---|---|
| cu126 | 2.13.0+cu126 | 12.6 | sm_50, sm_60, sm_70, sm_75, sm_80, sm_86, sm_90 |
| cu130 | 2.13.0+cu130 | 13.0 | sm_75, sm_80, sm_86, sm_90, sm_100, sm_120 |
| cu132 | 2.13.0+cu132 | 13.2 | sm_75, sm_80, sm_86, sm_90, sm_100, sm_120 |
A CUDA version reported by the Windows driver describes driver capability, not an Ubuntu CUDA Toolkit installation or the wheel’s embedded runtime. The environments did contain wheel-managed NVIDIA runtime packages; “no Toolkit” here means no system Toolkit and no nvcc.
Every operation ran in a separate Python process. The wrapper retained JSON stdout, stderr, exit code, duration, and a post-failure nvidia-smi health check. Across the full initial and follow-up experiment there were 195 child records: 150 passes and 45 exceptions matching the frozen validator’s expected signatures, with zero wrong results, zero signals, zero timeouts, and zero JSON parse failures. All 45 post-failure GPU health checks passed.
Finding 1: all three wheels said CUDA was available
The metadata probe returned the same high-level state for every wheel:
| Field | cu126 | cu130 | cu132 |
|---|---|---|---|
| Device count | 1 | 1 | 1 |
is_available() | 3/3 true | 3/3 true | 3/3 true |
| Reported capability | 12.0 | 12.0 | 12.0 |
sm_120 in arch list | no | yes | yes |
This is the mirror image of the failure in my previous PyTorch post. There, availability was false because a CUDA 13 wheel could not initialize against an older driver. Here, initialization and enumeration succeeded for cu126. Actual kernels were the missing layer.
PyTorch’s checked CUDA architecture table matches the arch lists emitted by the wheels: the CUDA 12.6 row ends at Hopper 9.0, while the CUDA 13.0 and 13.2 Linux rows include Blackwell 12.0+PTX.
Finding 2: the core matrix split on native kernels
The original matrix used three fresh processes per cell:
| Operation as executed | cu126 | cu130 | cu132 |
|---|---|---|---|
| Metadata and device enumeration | 3/3 | 3/3 | 3/3 |
Allocate 1 byte → GPU fill_ → read | 0/3 | 3/3 | 3/3 |
GPU arange → vector add | 0/3 | 3/3 | 3/3 |
dot, n=1 | 3/3 | 3/3 | 3/3 |
dot, n=4 | 3/3 | 3/3 | 3/3 |
dot, n=32 | 3/3 | 3/3 | 3/3 |
dot, n=1024 | 3/3 | 3/3 | 3/3 |
(x * y).sum(), n=4 | 0/3 | 3/3 | 3/3 |
GPU ones → FP32 512² GEMM | 0/3 | 3/3 | 3/3 |
GPU ones → BF16 512² GEMM | 0/3 | 3/3 | 3/3 |
| Core total | 15/30 | 30/30 | 30/30 |
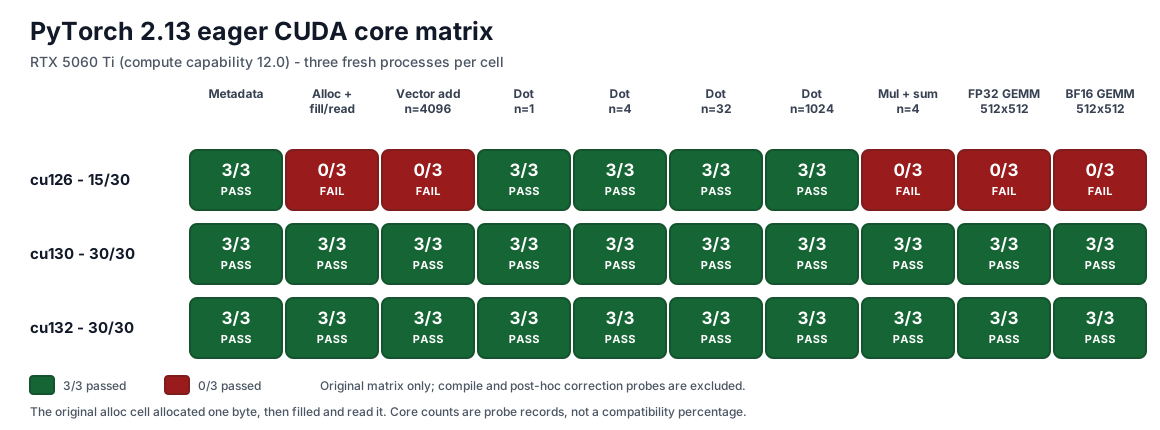
Figure 1. Three fresh processes per cell. The count is an operation matrix, not a percentage estimate of all PyTorch CUDA support.
cu130 and cu132 produced the expected values in every core process. The FP32 and BF16 ones matrices had output minimum and maximum 512. The length-4 CPU-prepared dot result was 1.3987812995910645; its absolute error against the CPU float64 reference was 1.820e-08, below the 1.399e-05 tolerance.
cu126’s exceptions all had the same CUDA signature:
CUDA error: no kernel image is available for execution on the device
There was no SIGFPE, core dump, timeout, or driver-health failure.
Finding 3: cu126 allocation and GEMM were not the failing steps
The first matrix combined several steps. Calling it an “allocation failure” would have been wrong because its traceback stopped at value.fill_(7), after torch.empty returned. The GEMM probes stopped while creating GPU torch.ones, before @ ran.
I froze a follow-up and separated those paths. cu130 was the positive control:
| Post-hoc operation | cu126 | cu130 |
|---|---|---|
| Allocate only, then synchronize | 3/3 | 3/3 |
| CPU byte → H2D → D2H | 3/3 | 3/3 |
Allocate → GPU fill_ → D2H | 0/3 | 3/3 |
| H2D input → pointwise add → D2H | 0/3 | 3/3 |
| H2D ones → FP32 GEMM → D2H | 3/3 | 3/3 |
The H2D-prepared cu126 GEMM returned min=max=512 in every process. A second, seeded 128×128 BF16 check prepared and quantized both inputs on the CPU, ran the multiply on CUDA, and compared against an FP32 CPU reference. All three wheels passed 3/3; maximum absolute error was 0.1247406006 with a preregistered tolerance of 1.0305688477.
I am not assigning these working paths to cuBLAS, PTX JIT, or another internal implementation. The harness did not trace the dispatch backend. The measured distinction is narrower: cu126 lacked native kernels for common tensor creation and pointwise operations on sm_120, while some copy, dot, and matrix-multiply paths completed correctly.
Finding 4: the reported RTX 5060 Ti dot crash did not reproduce on cu130 or cu132
PyTorch issue #178038 reports a hard SIGFPE from this path on an RTX 5060 Ti with PyTorch 2.10.0+cu128:
x = torch.rand(4, device="cuda")
y = torch.rand(4, device="cuda")
torch.dot(x, y)
I ran that GPU-input path in fresh 2.13 processes:
| Wheel | GPU rand reached dot | Result |
|---|---|---|
| cu126 | 0/3 | stopped first at torch.rand with no-kernel-image |
| cu130 | 3/3 | dot passed, no signal |
| cu132 | 3/3 | dot passed, no signal |
cu130 and cu132 returned 0.701409101486206; absolute error against the CPU float64 reference was 4.215e-09. The reported SIGFPE did not reproduce on this fixed WSL2 host and these 2.13 builds. That does not establish that every 2.13 driver, OS, or input avoids it.
The cu126 row is not a dot result. It never reached dot because GPU random-number generation failed first. With CPU-prepared inputs copied to CUDA, cu126 dot itself passed all 12 original dot processes.
Secondary result: torch.compile needed two host prerequisites
Compile was outside the eager-core gate. The first compile probes reported no C compiler; after I added g++, they reported a missing Python.h:
| Guest state | cu126 | cu130 | cu132 |
|---|---|---|---|
| Minimal guest | 0/3, no kernel at GPU linspace | 0/3, C compiler missing | 0/3, C compiler missing |
Add g++ | 0/3, same eager failure | 0/3, Python.h missing | 0/3, Python.h missing |
Add python3-dev | 0/3, same eager failure | 3/3 | 3/3 |
The final cu130/cu132 compiled function matched eager output with maximum error 0 in all six fresh-process invocations. I did not treat the first two rows as wheel failures. They were build-environment failures. g++ and python3-dev supplied a host compiler and CPython headers only; nvcc and a system CUDA Toolkit were still absent. I also did not time compile because the preregistered timing protocol was not run and compiler caches could affect later processes.
The allocator scout was not a comparable reproduction
I also checked an open WSL report, #192330, because it used the same Windows build family, WSL kernel, and driver 610.88. Its expandable_segments failure requires CUDA Driver attribute 110 (GPU_DIRECT_RDMA_WITH_CUDA_VMM_SUPPORTED) to be advertised as 1.
My corrected 1,024-byte allocation passed default, expandable-segments, and cudaMallocAsync 3/3. The same host reported attribute 110 as 0 in all three reads. The prerequisite for the reported RDMA-VMM path was absent, so this is not evidence that the issue is fixed or disproved on bare metal. I left it out of the main wheel verdict.
What I changed after the first run
A separate result-audit pass found four protocol mismatches. I kept the original records and added new condition names; no core count was overwritten.
| Initial record | Problem | Frozen correction |
|---|---|---|
| allocator filename said n=1024 | operation still allocated 1 byte | exact 1,024-byte allocation, 3× per allocator |
| “allocation” probe | combined allocate, fill, and read | isolated allocation, fill, and copy paths |
| BF16 plan said random + CPU reference | first probe used ones + exact 512 | seeded 128² BF16/FP32-reference check |
| “exact dot” used CPU random inputs | issue used GPU-side random inputs | GPU rand → dot path, 3× per wheel |
The original torch.ones GEMM remains in the core matrix because it is a realistic composite smoke test. The follow-up is what prevents me from mislabeling where cu126 stopped.
Install and verify the tested path
For PyTorch 2.13 on this RTX 5060 Ti, this is the stable build I would choose:
test ! -e .venv-cu130 && \
python3 -m venv .venv-cu130 && \
.venv-cu130/bin/python -m pip install --no-cache-dir \
  torch==2.13.0 --index-url https://download.pytorch.org/whl/cu130
Do not stop at availability. Run a small native-kernel test with the same Python your workload will use:
.venv-cu130/bin/python - <<'PY'
import torch

print("torch:", torch.__version__)
print("runtime:", torch.version.cuda)
available = torch.cuda.is_available()
print("available:", available)
assert available, "CUDA initialization failed"
print("device:", torch.cuda.get_device_name(0))
print("capability:", torch.cuda.get_device_capability(0))
print("arch list:", torch.cuda.get_arch_list())

x = torch.arange(4096, dtype=torch.float32, device="cuda")
y = x + x
torch.cuda.synchronize()
assert y.sum().item() == 4096 * 4095
print("native kernel check: pass")
PY
That check deliberately uses the path cu126 could not run here. A copied tensor plus one library operation would have produced a misleading green result.
Do not install a Linux NVIDIA display driver inside WSL. NVIDIA’s CUDA on WSL guide uses the Windows driver as the WSL GPU driver. If another wheel reports a driver mismatch rather than a missing kernel image, diagnose that separately.
Scope and limitations
- One RTX 5060 Ti 8 GB, one Windows/WSL host, and one installed environment per wheel. Three fresh processes establish repeatability on this machine, not three independent systems.
- This was Linux x86-64 under WSL2. Native Windows, native Linux, containers, other RTX 50-series GPUs, multi-GPU, and later PyTorch or driver builds were not tested.
- cu132 was experimental in the release-matrix snapshot. Its 30/30 eager result does not make it stable or preferred.
- The official wheel conditions brought different NVIDIA dependency stacks with them. This is a comparison of the published wheel environments, not only one runtime DLL in isolation.
- GPU temperature stayed between 41 and 60°C during recorded checks, but I did not run the planned CUDA-event timing protocol. There are no speed, power, or latency claims here.
- Vector-add correctness used a deterministic sum rather than an element-by-element comparison. There were no wrong-result records, but that checksum is not an exhaustive numerical test.
- Minimal venvs did not include NumPy, so imports emitted an unrelated “Failed to initialize NumPy” warning. The probes did not convert CUDA tensors through NumPy.
- The original probe source was not hashed before the first run. Raw JSON preserves commands, tracebacks, results, and timestamps; the complete evidence tree and current scripts were hashed after the audit.
Measured on my own machine on 2026-08-24. The sanitized publication log lists the environment, every matrix count, follow-up values, deviations, and validation totals. If another 2.13 build or RTX 50-series card produces a different split, tell me.