Qwen3-8B completed all nine primary runs on this 16GB M4. Increasing the configured context from 2K to 8K, while also filling it with more input, raised median time to first generated content from 14.7 to 87.1 seconds. Process peak RSS rose from about 5.09 to 5.94 GiB. System swap usage stayed at zero in the saved samples.
The separate 16K scout loaded the model and its KV buffer, but produced no first content within my 120-second limit. I stopped it there. That cutoff says how long I waited; it does not establish the maximum context this Mac can run.
The session summary, all nine rows as CSV, results JSON, and sanitized raw evidence ZIP are public. Scouts remain separate from the primary results.
More input meant a longer wait
Here, 2K means a configured capacity of 2,048 tokens. I sent exactly capacity - 256 input tokens and requested 128 output tokens. The inputs were progressively longer prefixes of one synthetic notebook. This changes both capacity and actual input length; it is not a test of the context-size flag with an identical prompt.
| Capacity | Actual input | First content, seconds | Complete 128 tokens, seconds | Peak RSS, GiB | F16 KV, MiB |
|---|---|---|---|---|---|
| 2K | 1,792 | 14.71 (11.85–22.37) | 23.78 (20.14–35.56) | 5.092 | 288 |
| 4K | 3,840 | 39.12 (27.54–47.74) | 52.02 (36.42–62.05) | 5.374 | 576 |
| 8K | 7,936 | 87.07 (70.72–97.16) | 104.83 (85.70–119.48) | 5.939 | 1,152 |
Open a chart to view it at full size. Tables scroll horizontally on narrow screens.
Timing cells show the median and full range of three runs. RSS is the median of the three process lifetime peaks from macOS time -l; KV is the runtime allocation printed on every run. The timing range is observed variation, not a confidence interval.
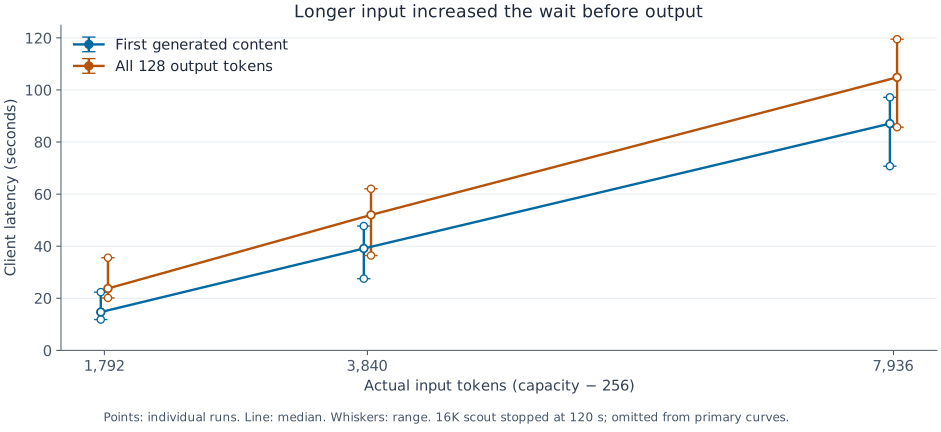
First-content latency starts immediately before the local HTTP request and ends at the first nonempty generated-content event in the saved SSE stream. It excludes model startup and tokenization, and includes request handling and prompt evaluation. Completion latency ends at the final SSE result. A keepalive or an empty event does not count as first content.
Startup was separately recorded at 0.64–0.77 seconds in these runs. Each server was a fresh process with its default startup warmup. Reading the whole model for hash verification can warm the file cache, so those startup numbers are not cold-cache load times.
The run order and every timing are below. I kept the slower repeats.
| Run | Capacity / repeat | First content, s | Complete, s | Server decode, tokens/s |
|---|---|---|---|---|
| 1 | 2K / 1 | 11.845 | 20.141 | 15.310 |
| 2 | 4K / 1 | 27.536 | 36.418 | 14.299 |
| 3 | 8K / 1 | 70.724 | 85.699 | 8.482 |
| 4 | 8K / 2 | 97.160 | 119.480 | 5.690 |
| 5 | 2K / 2 | 22.370 | 35.561 | 9.628 |
| 6 | 4K / 2 | 39.123 | 52.016 | 9.851 |
| 7 | 4K / 3 | 47.739 | 62.048 | 8.876 |
| 8 | 8K / 3 | 87.074 | 104.832 | 7.152 |
| 9 | 2K / 3 | 14.711 | 23.779 | 14.006 |
The first-content range at 4K was 27.54–47.74 seconds. Later repeats were often slower, but the last 2K run improved again. I did not collect temperature or GPU-frequency traces, and ordinary apps remained open. These records cannot separate thermal effects, scheduling, background work, and other session variation. Server decode throughput uses llama.cpp’s reported generation interval; it is not 128 divided by end-to-end completion time.
Three memory numbers with different scopes
The 5,027,783,488-byte GGUF file did not describe the whole running workload. At 8K, the server reported 1,152 MiB of F16 KV allocation in addition to its model and compute buffers. Process RSS and those runtime buffers observe overlapping memory, so adding them would double-count parts of the allocation.
| Observation | What I recorded | Scope |
|---|---|---|
| Process RSS | ps for the exact server PID; time -l lifetime peak | Resident pages charged to that process |
| Runtime buffers | Model, KV and compute sizes in server stderr | llama.cpp’s allocation accounting |
| Compression and swap | vm_stat, vm.swapusage before and during each run | The whole Mac, including other apps |
Open the Archify memory-scope diagram. Its boxes show roles and shared memory, not measured allocation proportions.
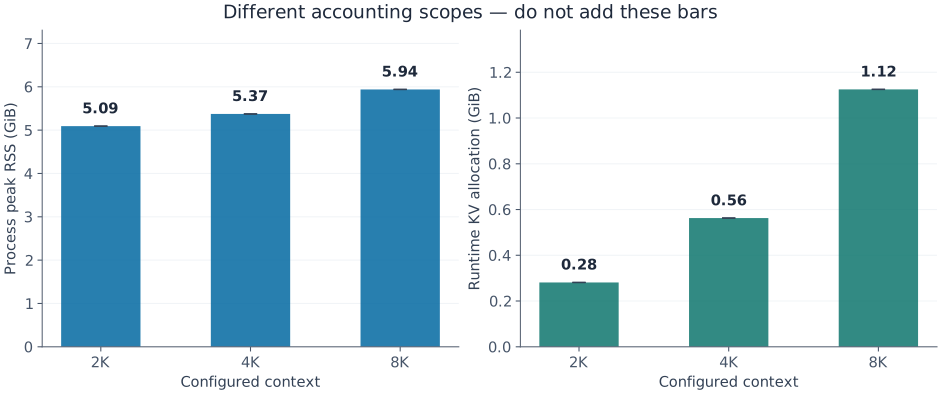
These are representative lines from the first 2K primary run:
load_tensors: offloaded 37/37 layers to GPU
load_tensors:   CPU_Mapped model buffer size =   333.84 MiB
load_tensors:  MTL0_Mapped model buffer size =  4789.19 MiB
llama_kv_cache:       MTL0 KV buffer size =   288.00 MiB
The full stderr files retain their original log prefixes. The excerpts above show the messages without those prefixes. All nine primary logs showed 37/37 layers offloaded, F16 K and V caches, and Flash Attention enabled. The mapped model buffer sizes stayed the same; MTL0 compute allocation was 32.78, 41.28 and 58.29 MiB at 2K, 4K and 8K.
The device listing’s recommended working-set allowance is another quantity. Apple’s recommendedMaxWorkingSetSize describes an approximate resource footprint that avoids a performance penalty. It is not a separate bank of dedicated VRAM that can be added to this Mac’s 16 GiB.
Zero swap did not mean unchanged system memory
Every saved primary sample reported zero system swap used and kernel dispatch pressure value 1. There were no recorded swapouts. But the seventh and eighth runs showed more physical memory occupied by the compressor, and nonzero pageout deltas.
| Run | Capacity | Peak compression minus baseline, MiB | Pageouts during run, MiB |
|---|---|---|---|
| 1 | 2K | -0.969 | 0.000 |
| 2 | 4K | -0.484 | 0.000 |
| 3 | 8K | -0.109 | 0.000 |
| 4 | 8K | -2.328 | 0.000 |
| 5 | 2K | -0.094 | 0.000 |
| 6 | 4K | -0.234 | 0.000 |
| 7 | 4K | +293.469 | 2.812 |
| 8 | 8K | +94.891 | 2.375 |
| 9 | 2K | -1.375 | 0.000 |
The baseline is the median of 31 pre-load observations over about 30 seconds. “Peak compression minus baseline” subtracts that median from the highest sampled compressor occupancy during the run. It can be negative when the system releases compressed pages after the baseline. I retained the sign.
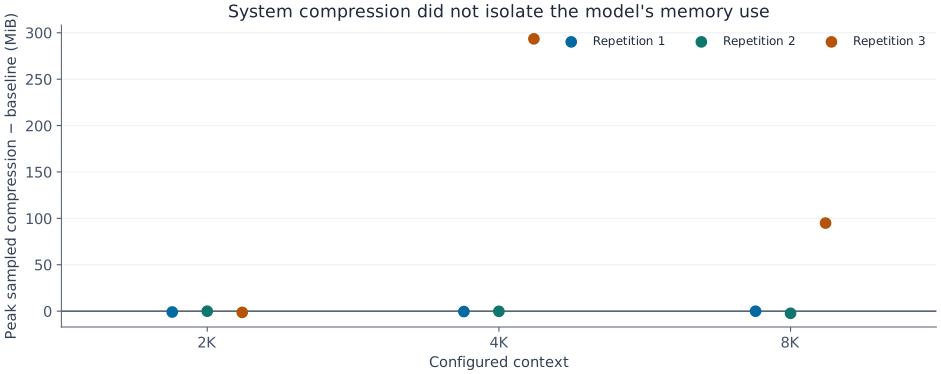
vm_stat reported a 16,384-byte page size. I multiplied “Pages occupied by compressor” by that size; “Pages stored in compressor” would describe a different, logical quantity. I converted ps RSS from 1,024-byte units, while macOS time -l reports peak RSS in bytes.
Kernel dispatch values 1/2/4 mean normal/warning/critical in the interface used here. They are not measurements of Activity Monitor’s green/yellow/red chart. Apple’s Activity Monitor guide describes a pressure display that combines several system signals; the XNU notification source converts the kernel level into dispatch flags for this sysctl.
The counters include other applications, and one-second samples can miss short events. I cannot assign the extra compression or pageouts solely to Qwen3. Zero observed swap growth also does not establish that a much longer session or another workload will avoid swap.
The 16K attempt stopped on time
The 16K scout requested 16,128 input tokens. It loaded all 37 layers on Metal and allocated a 2,304 MiB KV buffer. The saved progress log reached 9,728 processed input tokens at roughly 119 seconds after request start. No generated-content event arrived before the harness’s deadline.
TimeoutError: first_content_timeout_120_seconds
That is the harness’s error, not an out-of-memory message from llama.cpp. The 125 saved memory observations peaked at 7,542,767,616 bytes of sampled process RSS, with no swap growth and no sampled pressure warning. There is no completed TTFT or decode-throughput value to put beside the successful runs.
The interrupted shutdown also failed to finish cleanly. After the first interrupt and the supervisor’s shutdown escalation, the log contained:
Received second interrupt, terminating immediately.
GGML_ASSERT([rsets->data count] == 0) failed
The assertion came from ggml-metal-device.m:1021. The supervisor escalated to process-group termination; the recorded wrapper exit code was -15. Its time.txt was empty, so the process lifetime peak is unavailable; the sampled peak above is a different observation. I retained the failure files and did not label this an OOM or a successful 16K run.
Under the stop rule, 16K stayed out of primary measurement. The retained matrix was 2K/4K/8K, three times each, with order 2/4/8 → 8/2/4 → 4/8/2. All nine completed with the required input count, exactly 128 output tokens, no cached prompt tokens, and no truncation.
An earlier 2K scout stopped before sending any request because my backend check could not see the allocation messages. In this pinned build, the logging code routes library INFO messages to TRACE verbosity. I fixed the command at -lv 4 before primary measurement. That failed check remains a scout, too.
Fixed inputs and stop rules
| Item | Recorded setting |
|---|---|
| Host | Mac16,12, Apple M4, 10 CPU / 10 GPU cores, 17,179,869,184 bytes RAM |
| OS and power | macOS 26.6.2 build 25G83; AC connected; low power mode 0 |
| Model | Official Qwen3-8B Q4_K_M, 5,027,783,488 bytes |
| Model revision | 7c41481f57cb95916b40956ab2f0b139b296d974 |
| llama.cpp commit | e5a8d439cef31f27fad6938233da10dae1ba5631 |
| Build | CMake 4.1.3; Apple clang 21.0.0; native arm64 Release; Metal and Accelerate enabled |
| Harness | Python 3.13.7; loopback HTTP; one server and one request at a time |
| Context and cache | One slot; all GPU layers; fit off; F16 K/V; Flash Attention on; no context shift |
| Batches and threads | Batch 512; microbatch 128; 4 generation / 4 batch CPU threads |
| Request | Raw /completion; temperature 0; seed 20260910; ignore_eos=true; 128 output tokens |
| Prompt reuse | cache_prompt=false, fresh process, validated cache_n=0 |
| Baseline and recovery | About 30 seconds before load; 30 one-second observations after shutdown |
| Time limits | Startup 120 s; first content 120 s; whole request 180 s |
| System stop conditions | First sampled pressure warning; 1 GiB swap growth; under 5 GiB free disk; power change; missing/stale collector |
The frozen protocol also bounded baseline spread: 128 MiB for compression, 64 MiB for swap, and 512 MiB compression drift from the first primary baseline. Every retained trial passed those rules. No OS swap setting, Metal memory limit, cache purge, or app closure was part of the test. Site builds, browser testing and other benchmarks waited until primary measurement finished; text work and lightweight file reads continued.
This used exact integer prefixes of a fixed token array, with tokenization checked against the locked model. It bypassed chat templates and forced 128 generated tokens even if the model wanted to stop earlier. The task measures latency and memory for this synthetic input, not answer quality or a chat application’s behavior. The pinned server API reference defines the completion and streaming fields used by the harness.
Reproduce one bounded 2K run
This toolkit is restricted to an Apple M4 with exactly 16 GiB of physical memory. Its host check rejects other chips and RAM capacities. Run the following five Bash blocks in the same native arm64 macOS shell, from a directory where you want to retain the experiment. Use AC power with low power mode off. Apple’s Command Line Tools, Git, curl, Python 3.9 or newer, and at least 25 GiB free disk are prerequisites. The first block checks the platform, developer-tool path and available space; it installs CMake in a new venv.
The default model download is about 5 GB. If you already have this exact GGUF, you may set VRAMLAB_EXISTING_MODEL to its absolute path before starting; the recipe copies it into the new lab and checks both its size and SHA-256. Otherwise leave that variable unset. The experiment does not remove the new directory afterward.
set -euo pipefail
test "$(uname -s)" = Darwin
test "$(uname -m)" = arm64
xcode-select -p
python3 -c 'import platform, shutil, sys; assert platform.machine() == "arm64" and sys.version_info >= (3, 9); assert shutil.disk_usage(".").free >= 25 * 1024**3'
VRAMLAB_RUN="$(mktemp -d "$PWD/vramlab-m4.XXXXXX")"
export VRAMLAB_RUN
python3 -m venv "$VRAMLAB_RUN/tools"
"$VRAMLAB_RUN/tools/bin/python" -m pip --disable-pip-version-check \
  install --no-cache-dir cmake==4.1.3
VRAMLAB_BASE="${VRAMLAB_ARTIFACT_BASE:-https://vramlab.com}"
curl --fail --location --retry 3 \
  "$VRAMLAB_BASE/code/m4-context-toolkit-20260910.zip" \
  --output "$VRAMLAB_RUN/toolkit.zip"
"$VRAMLAB_RUN/tools/bin/python" - <<'PY'
import hashlib, os, zipfile
from pathlib import Path
root = Path(os.environ["VRAMLAB_RUN"])
archive = root / "toolkit.zip"
assert hashlib.sha256(archive.read_bytes()).hexdigest() == "3c17f976a9cb363df40051e6e2e8df94c532ca3d9ad9354bc42d22dee79c9b0f"
destination = root / "package"
assert not destination.exists()
with zipfile.ZipFile(archive) as z:
    assert all(not Path(n).is_absolute() and ".." not in Path(n).parts for n in z.namelist())
    z.extractall(destination)
PY
VRAMLAB_PACKAGE="$VRAMLAB_RUN/package"
VRAMLAB_DATA="$VRAMLAB_PACKAGE/data/mac"
mkdir -p "$VRAMLAB_DATA/models"
VRAMLAB_MODEL="$VRAMLAB_DATA/models/Qwen3-8B-Q4_K_M.gguf"
test ! -e "$VRAMLAB_MODEL"
if [ -n "${VRAMLAB_EXISTING_MODEL:-}" ]; then
  cp -n "$VRAMLAB_EXISTING_MODEL" "$VRAMLAB_MODEL"
else
  curl --fail --location --retry 3 \
    "https://huggingface.co/Qwen/Qwen3-8B-GGUF/resolve/7c41481f57cb95916b40956ab2f0b139b296d974/Qwen3-8B-Q4_K_M.gguf" \
    --output "$VRAMLAB_MODEL.part"
  mv -n "$VRAMLAB_MODEL.part" "$VRAMLAB_MODEL"
fi
"$VRAMLAB_RUN/tools/bin/python" - "$VRAMLAB_MODEL" <<'PY'
import hashlib, sys
from pathlib import Path
p = Path(sys.argv[1])
assert p.stat().st_size == 5027783488
h = hashlib.sha256()
with p.open("rb") as f:
    for block in iter(lambda: f.read(4 * 1024 * 1024), b""):
        h.update(block)
assert h.hexdigest() == "d98cdcbd03e17ce47681435b5150e34c1417f50b5c0019dd560e4882c5745785"
print("locked model verified")
PY
test ! -e "$VRAMLAB_DATA/llama.cpp"
git init "$VRAMLAB_DATA/llama.cpp"
git -C "$VRAMLAB_DATA/llama.cpp" remote add origin \
  https://github.com/ggml-org/llama.cpp.git
git -C "$VRAMLAB_DATA/llama.cpp" fetch --depth 1 origin \
  e5a8d439cef31f27fad6938233da10dae1ba5631
git -C "$VRAMLAB_DATA/llama.cpp" checkout --detach FETCH_HEAD
"$VRAMLAB_RUN/tools/bin/cmake" \
  -S "$VRAMLAB_DATA/llama.cpp" -B "$VRAMLAB_DATA/build-metal" \
  -DGGML_METAL=ON -DCMAKE_BUILD_TYPE=Release
"$VRAMLAB_RUN/tools/bin/cmake" --build "$VRAMLAB_DATA/build-metal" \
  --config Release --target llama-server -j 4
"$VRAMLAB_DATA/build-metal/bin/llama-server" --list-devices
caffeinate -i -s "$VRAMLAB_RUN/tools/bin/python" -B \
  "$VRAMLAB_PACKAGE/scripts/mac_measure.py" reader \
  --protocol "$VRAMLAB_PACKAGE/protocol-mac-v2.json" \
  --context 2048 --out "$VRAMLAB_DATA/reader-2k"
A successful run writes reader-2k/result.json, raw server/SSE/memory records, and a validation receipt beside that directory. The validator checks 1,792 evaluated input tokens, 128 generated tokens, zero cached prompt tokens, 37/37 Metal layers and a 288 MiB F16 KV buffer. Separately inspect result.json and require exit_code to be 0 before treating the run as completed; the validation receipt does not enforce that exit-code check. An HTTP success by itself is insufficient. The new build need not have the original binary hash: the reader mode binds source, model, harness and input hashes, then verifies the resulting runtime behavior.
If a guard stops the run, keep the result and raw files. Do not count it as a completed measurement or replace a missing value with zero. The toolkit ZIP includes the fixed fixture and protocol; the recipe is a small reader reproduction, not the nine-run primary batch.
I replayed those five blocks in a new directory on this same Mac, with a fresh venv, source checkout, build and server process. I used the documented model-copy option and verified its hash. Before publication, a loopback HTTP mirror served the exact toolkit bytes referenced above. The reader replay receipt and separate raw archive record that run, which is excluded from the primary aggregates.
phase: reader; primary_eligible: false
input: 1792; output: 128; cached prompt tokens: 0
Metal layers: 37/37; F16 KV: 288 MiB
first content: 14.973078 s; completion: 24.359387 s
exit_code: 0 (independently inspected in result.json)
This verifies the reader procedure in separate local files and processes. It is not a second computer, a fresh macOS installation, or a second nine-run matrix.
Evidence and limits
The primary validator reparsed saved SSE and checked effective backend settings, counts, hashes and units. A separate audit, which did not import the runner or validator, reconstructed all nine rows from raw records and matched the published values. The evidence archive includes baseline, run and recovery observations, requests, SSE, stderr and time -l output, plus the failed scouts.
Public files replace private absolute paths and battery registry IDs. Each archive manifest records both the original raw-file hash and its public derivative hash. Hashes inside a redacted result.json still refer to original private bytes; use manifest.json when verifying downloaded files. Shared fixture and tokenizer files appear once under inputs/.
On this host, the retained workload completed through an 8K capacity with no sampled swap use, while first response became much slower as input grew. The experiment does not establish a maximum model size, a maximum usable context, long-session stability, or a speed comparison with CUDA. For the separately measured CUDA case, see mixed KV cache on the RTX 5060 Ti; its workload and timing scope differ. Other measured operations are indexed under Benchmarks.