I ran llama.cpp with a q8_0 K cache, a q4_0 V cache, -fa on, and all 29 model layers offloaded. The default CUDA build did not reject that configuration or print a fallback warning. Its 4,096-token prompt-processing median was 132.415 tokens/s.
The same commit built with GGML_CUDA_FA_ALL_QUANTS=ON reached 11,412 tokens/s with the same mixed cache: 86.18× the default-build median. A separate untimed scheduler trace explained the split. All 280 recorded FLASH_ATTN assignments were on CPU in the default mixed run and on CUDA in the all-quants mixed run. A default q8_0/q8_0 control put all 280 on CUDA.
At 16,384 and 32,768 prompt tokens, each default mixed process hit my preregistered 600-second limit before llama-bench emitted its three-sample JSON. The all-quants mixed build completed at medians of 6,784.09 and 4,090.05 tokens/s.
Quick answer: at the tested llama.cpp commit, I would compile with -DGGML_CUDA_FA_ALL_QUANTS=ON before using an asymmetric quantized KV cache such as q8_0/q4_0 on CUDA. The option is OFF by default in the pinned build documentation. It restored fused CUDA Flash Attention here, but it also increased this build’s time and CUDA-library size. Recheck the option and scheduler behavior on later commits rather than assuming this result is permanent.
Test setup
I pinned both source and model before building:
| Input | Frozen value |
|---|---|
| llama.cpp | f280b26983ad0fdb705a0d9ebf0503e76f2899b0 |
| Model repository | ggml-org/Qwen3-1.7B-GGUF |
| Model revision | daeb8e2d528a760970442092f6bf1e55c3b659eb |
| File | Qwen3-1.7B-Q4_K_M.gguf |
| File size | 1,282,439,264 bytes |
| SHA-256 | d2387ca2dbfee2ffabce7120d3770dadca0b293052bc2f0e138fdc940d9bc7b5 |
| Declared maximum context | 40,960 tokens |
The model is available from the pinned Hugging Face tree. I used separate clean build directories. These were the common settings:
GGML_CUDA=ON
GGML_NATIVE=ON
CMAKE_CUDA_ARCHITECTURES=120
CMAKE_BUILD_TYPE=Release
build parallelism=-j2
The only intentional CMake difference was:
default:     GGML_CUDA_FA_ALL_QUANTS=OFF
all-quants:  GGML_CUDA_FA_ALL_QUANTS=ON
Both builds passed an F16/F16 CUDA smoke test, reported the pinned source commit through llama-cli --version, and passed pre/post GPU identity checks. The guest contained CUDA Toolkit packages but no Linux NVIDIA display-driver package; WSL used the Windows driver.
The PP command shape was:
llama-bench -m <model.gguf> \
  -p 4096 -n 0 -r 3 -b 2048 -ub 512 \
  -ctk q8_0 -ctv q4_0 -t 8 -ngl 99 -fa on -o json -v
For TG after a 4,096-token prefill depth, it was:
llama-bench -m <model.gguf> \
  -p 0 -n 128 -d 4096 -r 4 -b 2048 -ub 512 \
  -ctk q8_0 -ctv q4_0 -t 8 -ngl 99 -fa on -o json -v
llama-bench’s built-in TG warm-up does not exercise the requested depth. I therefore retained all four raw TG samples, treated raw sample 0 as target-depth first-use warm-up, and calculated the reported median from raw samples 1–3. PP reports all three raw repetitions. No statistical outlier was removed.
The untimed scheduler diagnostic
The ordinary verbose logs showed CUDA model buffers, CUDA KV buffers, and CUDA compute buffers for both mixed runs. Those facts do not prove where the attention node executed: other layers and buffers can remain on CUDA while one graph node is assigned elsewhere. The JSON backends and flash_attn fields describe registered/requested state, not the backend selected for each node. Process-wide nvidia-smi telemetry has the same limitation.
I kept backend classification out of the timed processes. A separate 64-token diagnostic used GGML_SCHED_DEBUG=2, one repetition, and --no-warmup:
| Build and cache | CPU FLASH_ATTN assignments | CUDA assignments | Other/unparsed |
|---|---|---|---|
Default, q8_0/q8_0 control | 0 | 280 | 0 |
Default, q8_0/q4_0 mixed | 280 | 0 | 0 |
All-quants, q8_0/q4_0 mixed | 0 | 280 | 0 |
The scheduler’s fixed-width output truncates FLASH_ATTN_EXT to FLASH_ATTN. Every matching line had to agree; throughput was not accepted as dispatch proof.
The pinned CUDA Flash Attention source rejects mixed K/V types from the default all-quants-disabled support path. The backend scheduler can then assign the graph node to CPU. With all-quants enabled, static source inspection indicates F16 staging plus the fused MMA path for multi-token PP and a mixed q8_0/q4_0 vector specialization for one-token TG. The separate PP64 scheduler trace directly established only the diagnostic’s CUDA assignment; I did not capture a TG scheduler trace. This is a narrower claim than “the whole model fell back to CPU.” It did not.
The behavior matches the class of problem described in llama.cpp issues #20866 and #24485. My tables below are new measurements from the pinned host and do not reuse the issue reporters’ numbers.
Scout result and branch decision
I first ran three 4K PP scouts. Their selected medians were:
default q8_0/q8_0       10,806.1 tokens/s
default q8_0/q4_0          136.994 tokens/s
all-quants q8_0/q4_0    11,387.4 tokens/s
The mixed all-quants/default ratio was 83.12×, above the preregistered 3× branch threshold, and the scheduler diagnostic showed the expected CUDA/CPU split. I therefore ran the full 16-PP plus 16-TG matrix.
Prompt-processing results
These are medians of the three listed PP repetitions. A timeout cell has no throughput value because llama-bench had not emitted JSON.
| Prompt tokens | F16/F16 default | q8/q8 default | q4/q4 default | q8/q4 default | q8/q4 all-quants |
|---|---|---|---|---|---|
| 4,096 | 12,060.7 | 11,435.4 | 11,014.0 | 132.415 | 11,412.0 |
| 16,384 | 6,991.86 | 6,761.78 | 6,798.86 | >600 s timeout | 6,784.09 |
| 32,768 | 4,293.93 | 4,096.21 | 4,143.43 | >600 s timeout | 4,090.05 |
At 4K, all-quants mixed was 86.18× the default mixed median. Its 11,412.0 tokens/s was also close to the default symmetric controls; the experiment does not require treating quantized cache types as normally slow.
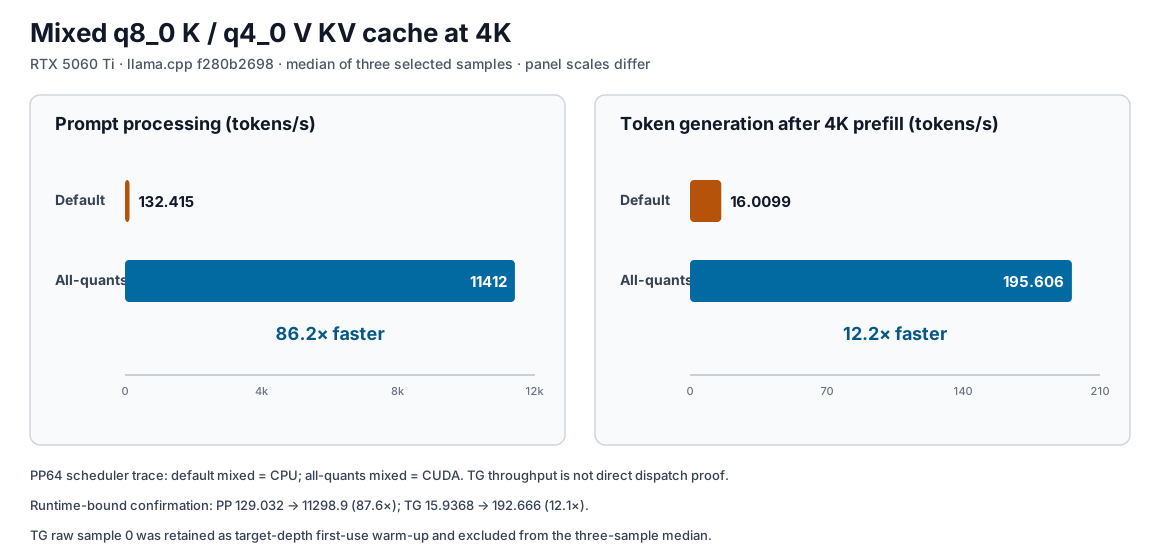
Figure 1. Primary 4K medians. The PP and TG panels use separate linear scales. The scheduler assignment came from a separate PP64 diagnostic; TG has no direct dispatch trace.
The two longer default mixed PP processes each reached the 600-second wrapper limit, exited with -15, and left empty stdout. Their stderr, roughly 3,002 process-wide telemetry samples each, and healthy post-timeout GPU checks were retained. I do not derive a partial tokens/s estimate from them.
I also tested q8_0/q8_0 at 16K in both builds to check whether the all-quants build alone imposed a broad cost. The default median was 6,761.78 tokens/s; all-quants was 6,750.78, a -0.16% difference in this one three-sample control. That is not a general overhead bound, but it makes a whole-build slowdown an implausible explanation for the mixed result.
Token generation after prefill
TG was secondary. Each process prefills the requested depth, then measures 128 generated tokens. Values below are medians of selected raw samples 1–3:
| Prefill depth | F16/F16 default | q8/q8 default | q4/q4 default | q8/q4 default | q8/q4 all-quants |
|---|---|---|---|---|---|
| 4,096 | 183.012 | 196.011 | 197.853 | 16.0099 | 195.606 |
| 16,384 | 109.381 | 136.208 | 133.626 | >600 s timeout | 137.188 |
| 32,768 | 68.8306 | 97.9884 | 98.8625 | >600 s timeout | 98.0596 |
At 4K depth, all-quants mixed was 12.22× the default mixed median. The 16K and 32K default mixed processes timed out before emitting JSON. Those process limits include depth prefill, so I cannot isolate a generation-only failure or speed from the timeout cells.
The 16K all-quants q8_0/q8_0 build control had a 135.070 tokens/s median versus 136.208 for the default build. As with PP, this small one-host difference is only a control against a broad build penalty.
KV memory did shrink
The mixed cache was not pointless from a memory perspective. llama.cpp reported these CUDA KV buffers for PP contexts:
| Context | F16/F16 | q8_0/q8_0 | q4_0/q4_0 | q8_0/q4_0 |
|---|---|---|---|---|
| 4,096 | 448 MiB | 238 MiB | 126 MiB | 182 MiB |
| 16,384 | 1,792 MiB | 952 MiB | 504 MiB | 728 MiB |
| 32,768 | 3,584 MiB | 1,904 MiB | 1,008 MiB | 1,456 MiB |
At each context, q8_0/q4_0 used 23.5% less KV memory than q8_0/q8_0. I did not test whether that asymmetric choice preserves model quality better than q4_0/q4_0; there is no perplexity, retrieval, or output-equivalence claim here.
The default mixed logs still said the KV buffer itself was on CUDA. That is precisely why buffer placement is weak dispatch evidence: the scheduler trace showed the attention operation on CPU while the cache stayed allocated on the GPU.
Across all matrix processes, whole-process telemetry ranged from 39–76°C, 1,327–6,444 MiB used, and 25.61–180.81 W. These ranges mix model load, warm-up or depth prefill, timed repetitions, and teardown. I do not report them as timed power, memory, or utilization results.
Build cost and the integrity follow-up
The all-quants option had a visible build cost on this machine:
| Build | Wall time, -j2 | Resolved libggml-cuda size |
|---|---|---|
| Default | 14:15.40 | 66,752,696 bytes |
| All-quants | 17:18.93 | 85,419,176 bytes |
That was 21.5% more build wall time and 28.0% more CUDA-library bytes here. The pinned documentation warns that enabling kernels for all quantization types substantially increases compilation work. These values depend on this CPU, compiler, memory limit, and build order.
A final audit found a protocol defect before publication: my primary prerequisite record had pre-bound the 17,920-byte llama-bench launcher and CMake cache, but the launcher dynamically loads the actual implementation. It had not individually pre-bound the complete shared-library closure.
I did not rewrite the primary records. Instead, I added a post-matrix manifest for the eight resolved build-owned runtime files in each variant, including symlink/ldd resolution, size, mtime, and SHA-256. Because that capture happened after the matrix, it cannot retroactively become a full pre-bind.
I then repeated the backend diagnostic with that closure pinned and exact pre/post GPU identity. Finally, I ran a new four-condition 4K confirmation that pre-bound the closure:
| Confirmation | Default mixed | All-quants mixed | Ratio |
|---|---|---|---|
| PP | 129.032 | 11,298.9 | 87.57× |
| TG | 15.9368 | 192.666 | 12.09× |
All four confirmation records passed. A post-confirmation manifest matched every resolved runtime path, size, mtime, and SHA-256 to the pre-confirmation manifest. This confirms the key 4K split under the corrected binding, while preserving the narrower integrity scope of the original 32-condition matrix.
Two harness failures I kept
The first build wrapper called llama-bench --version. This pinned binary does not implement that option; it printed usage and an invalid-parameter error. I retained that output and changed only the evidence probe to llama-cli --version.
The first correction still failed because llama-cli writes its version to stderr and the probe checked stdout only. A second addendum combined stdout and stderr, recovered f280b2698, and only then continued to the all-quants build and timed runs. Neither correction rebuilt or replaced the already completed default binaries.
The ordinary mixed run printed no explicit fallback or unsupported-kernel warning. Warning absence is not evidence of CUDA execution, especially with Flash Attention explicitly requested through -fa on.
Reproduce the tested build and checks
Start from the pinned source and use new build directories:
git clone https://github.com/ggml-org/llama.cpp.git
git -C llama.cpp checkout f280b26983ad0fdb705a0d9ebf0503e76f2899b0

CUDA_ROOT=/usr/local/cuda-13.2

cmake -S llama.cpp -B build-default -G Ninja \
  -DCMAKE_BUILD_TYPE=Release \
  -DCMAKE_CUDA_COMPILER="$CUDA_ROOT/bin/nvcc" \
  -DGGML_CUDA=ON \
  -DGGML_CUDA_FA_ALL_QUANTS=OFF \
  -DGGML_NATIVE=ON \
  -DGGML_BUILD_TESTS=OFF \
  -DLLAMA_CURL=OFF \
  -DCMAKE_CUDA_ARCHITECTURES=120
cmake --build build-default --target llama-bench llama-cli -j2

cmake -S llama.cpp -B build-all-quants -G Ninja \
  -DCMAKE_BUILD_TYPE=Release \
  -DCMAKE_CUDA_COMPILER="$CUDA_ROOT/bin/nvcc" \
  -DGGML_CUDA=ON \
  -DGGML_CUDA_FA_ALL_QUANTS=ON \
  -DGGML_NATIVE=ON \
  -DGGML_BUILD_TESTS=OFF \
  -DLLAMA_CURL=OFF \
  -DCMAKE_CUDA_ARCHITECTURES=120
cmake --build build-all-quants --target llama-bench llama-cli -j2
Before timing, run a diagnostic separately:
GGML_SCHED_DEBUG=2 build-default/bin/llama-bench \
  -m <model.gguf> -p 64 -n 0 -r 1 --no-warmup \
  -b 64 -ub 64 -ctk q8_0 -ctv q4_0 \
  -t 8 -ngl 99 -fa on -o json -v 2>scheduler.txt

grep 'FLASH_ATTN' scheduler.txt
Do not mix scheduler-debug timing into the performance table. Also verify the actual resolved shared objects, not only the launcher and cache flags. The sanitized publication log lists all selected and raw samples, build hashes, timeout records, validation hashes, and the post-bound confirmation.
Scope and limitations
The benchmark index links this dispatch experiment with the model-loading and storage measurements. For Python workloads on the same GPU family, the PyTorch wheel matrix covers a separate compatibility layer; PyTorch is not a prerequisite for the llama.cpp build tested here.
- One RTX 5060 Ti, one Windows/WSL host, one driver, one llama.cpp commit, and one Qwen3 1.7B GGUF were tested. Native Windows, native Linux, other GPUs, later commits, and multi-GPU were not.
- llama-bench uses synthetic tokens and excludes tokenization and sampling. This is a kernel/backend and throughput experiment, not an end-to-end chat benchmark.
- There is no model-quality comparison between F16, symmetric quantized, and asymmetric quantized caches.
- Three selected samples establish repeatability on this process and host, not population-level confidence. No formal significance test was run.
- The four 600-second cells establish process timeout under this wrapper. They do not supply hidden partial throughput or a generation-only measurement.
- Global GPU telemetry includes Windows desktop activity and all llama-bench phases. It is retained as process health/context only.
- The primary runtime closure was captured after the matrix. Only the four-condition confirmation and diagnostic v2 pre-bound it; the public log preserves that distinction.
Measured on my own machine on 2026-08-25. The publication log contains the complete condition summaries and integrity chain. If another commit or GPU assigns this mixed cache differently, tell me.