streaming=True avoided the downloaded CSV and prepared Arrow files in my small Hub test. It still left a README and cache bookkeeping on disk. In a separate, larger CSV/Parquet test, streaming left zero-length lock files in the isolated application directories after exit. Their summed file lengths were zero. It did fetch data again in the next process.
Reading 1,000 rows did not mean fetching exactly 1,000 rows of bytes. With the default settings, the local server completed 5.25 MiB of GET response bodies for CSV streaming and 36.02 MiB for Parquet streaming. Neither figure is a measurement of internet throughput or bytes consumed by the Python row iterator.
I ran 60 fresh Python processes, including three empty/reused cache pairs for every condition. The summary log, 60 rows as CSV, results JSON, sanitized run records, and reproduction toolkit are public. Failed preparation runs remain separate.
This follows HF_DATASETS_CACHE and the other files. That report moves and cleans existing caches. This one tests avoiding materialization in the first place.
The Hub test left metadata
I pinned lhoestq/demo1 to 87ecf163bedca9d80598b528940a9c4f99e14c11 and explicitly selected data/train.csv. All five train rows were consumed and their ordered hashes matched. Unlike the earlier cache experiment, this call did not select both splits.
| File after the process exited | Normal load | Streaming |
|---|---|---|
| Hub README blob | 2,665 bytes | 2,665 bytes |
| Hub train CSV blob | 1,446 bytes | Absent |
| Prepared train Arrow | 2,872 bytes | Absent |
| Dataset information JSON | 716 bytes | Absent |
Hub CACHEDIR.TAG | 191 bytes | 191 bytes |
| Total regular-file lengths | 7,890 bytes | 2,856 bytes |
| Allocated ext4 file blocks | 20,480 bytes | 8,192 bytes |
Zero-length locks and missing-file markers also remained. Snapshot symlinks pointed at the blobs; I did not count the same contents twice. The block totals exclude directory and inode metadata. Both runs in each of the three pairs had the same final byte totals.
The stream’s nonempty files were:
HF_HOME/hub/
├── CACHEDIR.TAG                         191 bytes
└── datasets--lhoestq--demo1/
    ├── blobs/<README blob>            2,665 bytes
    └── snapshots/<revision>/README.md -> the blob

No cached train.csv and no prepared .arrow file.
The streaming guide describes reading data during iteration. That does not mean the complete call writes no metadata. The cache guide separates Hub files from prepared Arrow. This tiny test establishes file placement, not a useful space-saving ratio for large datasets. I did not measure Hub network traffic.
A prefix read still triggered read-ahead
For a controlled comparison, I generated the same 200,000 id/payload rows in two formats. Each payload was a deterministic 384-character string. Parquet used Zstandard compression and row groups of 10,000 rows.
| Input | File length | Rows | First 1,000 rows’ ordered SHA-256 |
|---|---|---|---|
| CSV | 78,288,901 bytes | 200,000 | c9b4497f632bb3acfd2879826c401593e15b3cddfb229db9a6fc5e3fbb3347eb |
| Parquet | 58,908,496 bytes | 200,000 | Same |
The fixture manifest also pins the encoded file bytes:
CSV SHA-256:     7203c1651a2e88b250878fe74fbfd64f4bbbfca5fc6af130525b9978f746d300
Parquet SHA-256: 1652d4c1575b49ccf80157d53ad52db5079dc60fcb935256ea715461a1e093c4
A loopback HTTP server supported range requests and logged the method, range, response status, successful body writes and aborted responses. I used the built-in CSV/Parquet loaders with explicit URL data_files. This bypasses Hub dataset discovery; its downloaded-source cache is under the Datasets download directory, not the Hub blob directory.
| First 1,000 rows, empty application cache | Final cache files, MiB | Completed GET body, MiB | First row, seconds | RSS high-water at atexit, MiB |
|---|---|---|---|---|
| CSV, normal | 151.00 | 74.66 | 1.239 (1.229–1.275) | 218.20 |
| CSV, streaming | 0 | 5.25 | 0.729 (0.706–0.736) | 177.81 |
| Parquet, normal | 131.75 | 56.18 | 0.866 (0.861–0.887) | 264.27 |
| Parquet, streaming | 0 | 36.02 | 0.757 (0.737–0.757) | 235.05 |
Values are medians of three processes; parentheses give the observed full timing range, not a confidence interval. MiB means 1,048,576 bytes. The cache totals include source downloads, prepared Arrow and bookkeeping in the isolated home, HF cache, XDG cache, temporary directory and working directory. They exclude Python packages, the server’s input files and measurement records.
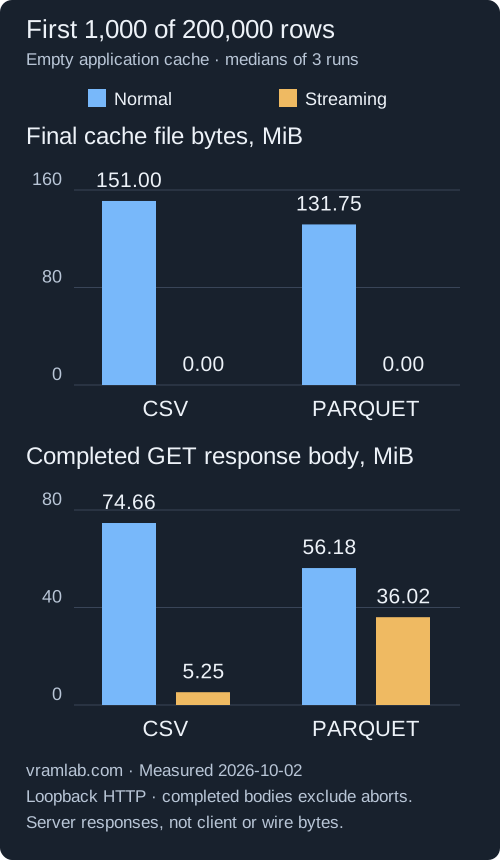
“Completed GET body” counts responses whose body the server wrote completely. It excludes aborted responses. There were additional successful body writes before aborted sends: the total logged writes for empty-cache CSV streaming ranged from 5.50 to 7.19 MiB, and for Parquet streaming from 36.09 to 37.52 MiB. These server counters do not count headers, TLS, client-consumed bytes or a partial write that raised an exception.
The request logs show ranges beyond the rows consumed, including overlapping reads. The result is specific to these file layouts and default buffering settings. It does not establish that Parquet always fetches more than CSV. I did not change the Parquet buffer, select fewer columns or apply filters.
For example, these are the completed GETs in the first empty-cache Parquet streaming prefix run. The separate aborted whole-file GET is excluded from this table:
| Request range | HTTP status | Completed body, bytes |
|---|---|---|
bytes=58842960-58908495 | 206 | 65,536 |
bytes=58842960-58908495 | 206 | 65,536 |
bytes=4-37642618 | 206 | 37,642,615 |
| Sum | 37,773,687 |
The normal loaders prepared all 200,000 rows even when I consumed only 1,000. Independently decoding their actual Arrow files recovered the full ordered row digest. Streaming’s final zero-byte footprint here is a post-exit observation, not a peak temporary-space measurement or Windows disk-space recovery.
Zero file bytes also does not mean no file creation. Here are selected fields from http-csv-stream-n1000-r1/empty/after.json; its one regular entry was a .lock in HF_HOME/datasets:
{
  "regular_bytes_unique_inodes": 0,
  "allocated_bytes_unique_inodes": 0,
  "entries": [
    {
      "type": "file",
      "bytes": 0,
      "allocated": 0,
      "sha256": "e3b0c44298fc1c149afbf4c8996fb92427ae41e4649b934ca495991b7852b855"
    }
  ]
}
The next process read the server again
Each second run reused exactly the preceding run’s application directories. It was still a fresh Python process. I did not clear Linux or Windows file caches.
| First 1,000 rows, reused application cache | Completed GET body, MiB | First row, seconds | All 1,000 rows plus digest, seconds |
|---|---|---|---|
| CSV, normal | 0 | 0.701 | 0.712 (0.685–0.735) |
| CSV, streaming | 5.25 | 0.724 | 0.728 (0.715–0.728) |
| Parquet, normal | 0 | 0.679 | 0.690 (0.678–0.745) |
| Parquet, streaming | 36.02 | 0.752 | 0.763 (0.744–0.799) |
The normal runs reused their unchanged Arrow/source files. Their zero in this column does not mean zero network activity: each still made HEAD requests and a GET that the client abandoned. The server logged 0.375–1.188 MiB of successful writes before those CSV GETs were interrupted, and 0.625–1.250 MiB for Parquet. I did not disconnect the network or test offline loading.
Streaming had no persisted data-file cache to reuse in these URL cases. The next process again requested the ranges. Reusing the same HF_HOME did not remove that work.
Full-file reads also changed the picture:
| All 200,000 rows, reused application cache | Work and row digest, seconds | Completed GET body, MiB | RSS high-water at atexit, MiB |
|---|---|---|---|
| CSV, normal | 2.704 (2.704–2.772) | 0 | 228.79 |
| CSV, streaming | 1.927 (1.890–1.955) | 79.41 | 248.33 |
| Parquet, normal | 2.730 (2.652–2.853) | 0 | 228.24 |
| Parquet, streaming | 2.982 (2.921–3.070) | 61.30 | 329.89 |
CSV streaming was faster for this local-server workload despite re-reading the source. Parquet streaming had a higher RSS high-water value at atexit than the normal load. Disk materialization, elapsed time and memory are separate measurements. This synthetic, single-process test cannot rank internet streaming, DataLoader workers or training throughput.
My first Parquet probe did not exit
The first preparation probe returned the correct 1,000-row digest, then stayed alive. These are selected fields from its retained probe.json, written before shutdown:
{
  "requested_rows": 1000,
  "actual_rows": 1000,
  "ordered_sha256": "c9b4497f632bb3acfd2879826c401593e15b3cddfb229db9a6fc5e3fbb3347eb",
  "last_id": 999,
  "dataset_type": "IterableDataset",
  "load_s": 0.666831321,
  "first_row_s": 0.771958959,
  "work_s": 0.78313277,
  "peak_rss_kib_at_result": 239264,
  "cache_files": null
}
Its stderr included this traceback. Only the lab directory and generator address are replaced:
Exception ignored in: <generator object Parquet._generate_tables at <ADDRESS>>
Traceback (most recent call last):
  File "<LAB>/venv/lib/python3.12/site-packages/datasets/packaged_modules/parquet/parquet.py", line 227, in _generate_tables
AttributeError: 'NoneType' object has no attribute 'ArrowInvalid'
The driver stopped the process group at its 180-second limit. Its separate wrapper.json recorded:
{
  "status": "STOPPED_RESOURCE_LIMIT",
  "exit_code": -9,
  "process_wall_s": 180.056058546
}
I had left the iterator alive at interpreter shutdown. The corrected probe explicitly closed it, released its references and collected garbage after recording the measured row work:
# After consuming the required rows and recording work_s:
if hasattr(iterator, "close"):
    iterator.close()
del iterator, dataset
gc.collect()
The new preparation cohort completed all 12 processes; all 60 primary processes then exited normally. This was the observed correction on datasets 5.0.1/PyArrow 25.0.1, not a claim that every shutdown problem has this cause. The earlier Parquet shutdown report describes different versions. I did not pool my killed scout into the primary timing table.
Reproduce in a fresh WSL lab
Download the toolkit ZIP and place it in your current WSL directory. The commands create a new temporary lab and venv. Python 3.12 and python3-venv must already be installed. This needs internet access for packages and the tiny public Hub input, plus a few GiB of local space for the full cache matrix. The driver also requires at least 50 GiB free on Windows C:, visible through /mnt/c, as its host-space guard. It uses no login token or GPU.
export LAB=$(mktemp -d /tmp/vramlab-streaming.XXXXXX)
python3 -m venv "$LAB/venv"
source "$LAB/venv/bin/activate"
python -m zipfile -e hf-streaming-toolkit-20261002.zip "$LAB"
python -m pip install -r "$LAB/requirements.lock"
mkdir "$LAB/setup"
cp "$LAB/README.txt" "$LAB/setup/WORK_PLAN.md"
cp "$LAB/requirements.lock" "$LAB/setup/requirements.lock"
python "$LAB/scripts/capture_runtime.py" "$LAB/setup/runtime-before.json"
python "$LAB/scripts/fixture.py" "$LAB/fixture"
python "$LAB/scripts/protocol_check.py" "$LAB/fixture" "$LAB/setup/http-protocol-check.json"
python "$LAB/scripts/run_matrix.py" --fixture "$LAB/fixture" --output "$LAB/results"
python "$LAB/scripts/validate_results.py" --run "$LAB/results" \
  --fixture "$LAB/fixture" --output "$LAB/validation.json"
The commands run the full 60-process matrix and validate rows against decoded input. Timings and bookkeeping may differ; fixture hashes and row digests are fixed. The ZIP includes the complete package lock and file manifest. Output records contain temporary paths; inspect them before sharing.
First-row timing starts immediately before load_dataset() and ends when the first row returns. Work timing ends after the last requested row and its JSON digest update. Imports are outside both timers. RSS is ru_maxrss recorded in an atexit callback after explicit cleanup; it includes imports. Separate 50 ms VmHWM samples are retained in the wrappers. Cleanup and total process duration are recorded separately. Every process used an isolated HOME, HF_HOME, XDG_CACHE_HOME, TMPDIR and working directory.
Before/after hashes of package-owned files and the Python executable matched. Windows build and WSL version were verified after measurement in a same-day capture, timestamped in the results JSON. The validator independently decoded CSV, Parquet and cached Arrow to check row contents.
I replayed both Bash blocks verbatim in a second fresh Ubuntu Base 24.04.4 environment. All 60 processes completed and the validator passed 402,841 checks. A separate decoder checked the actual fixture and all 15 prepared Arrow files; their hashes matched the original inventories. The timing tables above remain the primary cohort, not a mixture of the two runs.
For prefix inspection, I would use streaming and check the response ranges. For repeated work, I would compare it with a materialized load: normal loading reused Arrow, while streaming’s time and RAM costs depended on format.
For relocating a model cache, use the Hub cache report. For reclaiming Windows allocation after deleting files, use the WSL VHDX experiment. This article measured application files inside ext4 and did not compact a VHDX.